
Ground Penetrating Radar (GPR) Products

Integrated Radar Inspection System
The IRIS GPR is offered in four versions, which are described below. A complete GPR system typically consists of a control unit, antenna(s), cables, software and other optional accessories, which may include GPS, vehicle mounting structure and/or transport cart..

Vehicle Installation Systems
Complete, low-cost vehicle installation systems can be used with multiple GPR IRIS configurations and will install on most light vans, pick-up trucks & SUV's.

Antennas
Available is a complete and comprehensive line of non-contacting and contacting antennas, covering a broad range of depth and resolution for pavement and bridge deck inspection applications, geotechnical and site surveys.
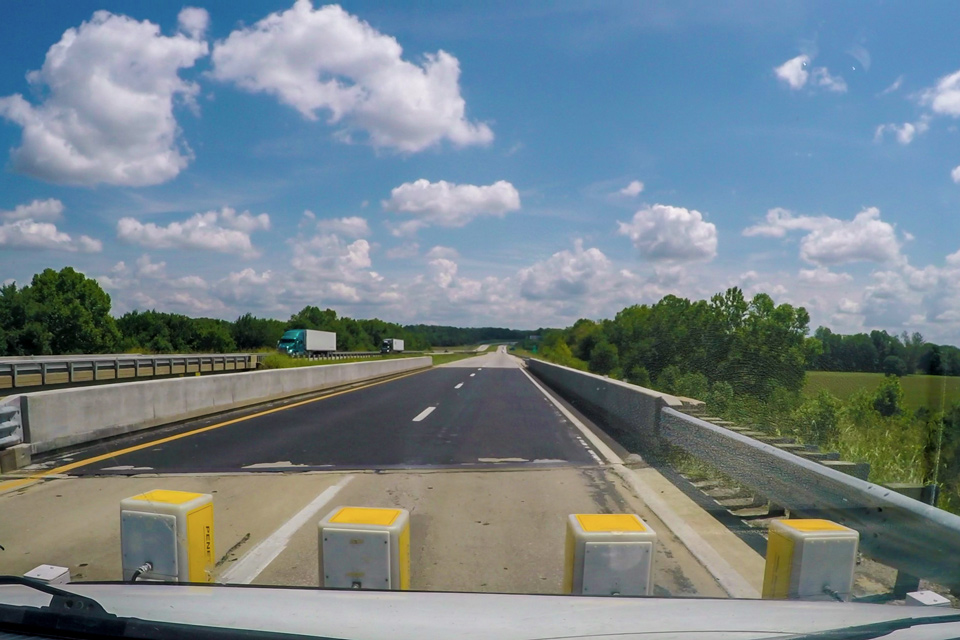
Expand Your Business with Penetradar's GPR Equipment
Our IRIS GPR Eqiupment can be utilized for bridge & pavement inspection as well as site surveys.
Technical Services Group (TSG)

Ground Penetrating Radar (GPR)
Our specialized IRIS Ground Penetrating Radar can be used for inspections of bridges and roadways while our portable units can be utilized for site surveys.

Infrared Thermography (IRT)
Infrared Thermography is a non-destructive technique that detects delaminations in reinforced concrete bridge decks, pavements and structures by measuring the thermal conduction/radiation characteristics of the concrete.

High Resolution Imaging (HRI)
High resolution (4K) imagery of highways and bridge deck surface conditions. Images are referenced utilizing DMI and GPS coordinates and results are presented in a plan-view format.
Discuss with our Technical Services Group
Our Services Team will be able to guide your company with the best approach to your projects needs.
Who We Are
Penetradar is a third generation company that has been a global leader in Ground Penetrating Radar (GPR) since 1974. We specialize in the development, manufacture, and application of GPR for nondestructive evaluation of civil and transportation infrastructure, and for geotechnical and subsurface environmental investigations.
Penetradar boasts proven longevity as a pioneer in the development and application of GPR technology. We pride ourselves on commitment to continuous innovation and advancing our technologies. That same commitment is applied to our manufacturing and application processes, resulting in the best possible product available to our customers.

NEWS


FEATURED PROJECTS